
Pie Chart
Pie Chart
A pie chart shows how a whole divides into parts. kymo's editor reads the
Mermaid pie syntax.
This page works like a quickstart: as you scroll, the pane on the right shows the source and the preview for the section you're reading. Copy grabs the source; ▶ Open in editor loads it into editor.kymo.studio (pick mermaid in the diagram-type dropdown when starting from scratch).
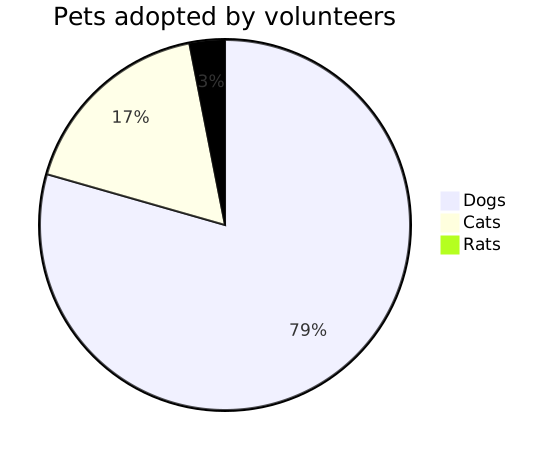
A pie source is just a header and one "label" : value line per slice.
Values are positive numbers (up to two decimals); slices are drawn clockwise
in source order, largest legend first.
Title and showData
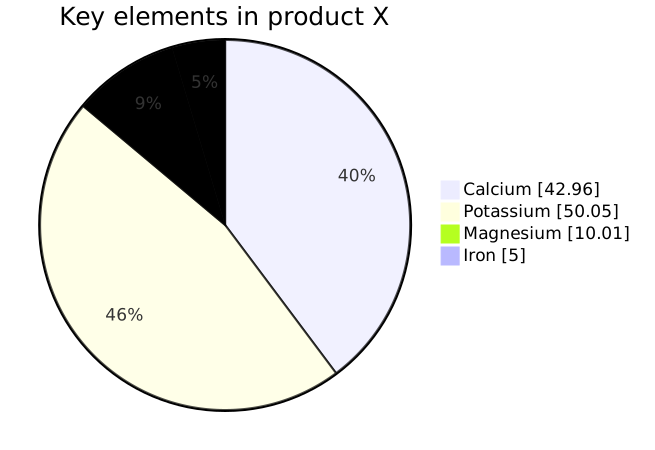
title after the pie keyword captions the chart; the showData flag also
prints each slice's raw value next to its percentage in the legend.
pie showData title Key elements in product X
    "Calcium" : 42.96
    "Potassium" : 50.05
    "Magnesium" : 10.01
    "Iron" : 5
Status. Pie chart previews on this page and in the editor use the Mermaid renderer; importing pie charts into kymo's own pipeline (native SVG/PNG/PDF rendering) is on the roadmap.
See also
- XY Chart — for bar and line series with real axes.
- Quadrant Chart — for plotting items against two dimensions.